Needing Just the Basics
Many Illinois households with children are just trying to pay the rent and put three full meals on the table. Even with government assistance, it remains a struggle for them. In 2021, nearly 1 in 6 Illinois (15.8%) children (or more than 440,000) were in poverty. Although this is an improvement from 2017 (18.8%), the data shows stark racial and ethnic disparities remain regarding child poverty. The child poverty rate decreased at a faster rate for Black and Latinx children from 2017 to 2021 (4.9% and 5.9% respectively), however it has been increasing recently for Black and Latinx families with the poverty rate for Black children at 35.5%, Latinx children at 19.2%, and white, non-Hispanic children at 9.1%.

Source: U.S. Census Bureau, American Community Survey

Source: U.S. Census Bureau, American Community Survey
Child poverty impacts every region in the state, but the picture differs depending on whether you look at the percentage of children in poverty versus the actual number of children in poverty. While Cook, Lake, and Winnebago counties (all in northern Illinois) have the highest numbers of children below the poverty level, Alexander, Pope, and Perry counties (all in southern Illinois) have the highest percentages of poverty for children.
Five Illinois counties that have the greatest percentage of children below 100% of the Federal Poverty Level.
| Alexander County | 35.8% |
| Pope County | 35.0% |
| Perry County | 31.2% |
| Vermilion County | 29.1% |
| Jackson County | 25.5% |
Source 2021, 5-year American Community Survey
Five Illinois counties that have the greatest number of children below 100% of the Federal Poverty Level.
| Cook County | 210,002 |
| Lake County | 17,608 |
| Winnebago County | 16,652 |
| Kane County | 16,182 |
| Will County | 15,608 |
Source 2021, 5-year American Community Survey
Children’s Advocates for Change has examined the data by counties, race, and ethnicity. You can find fact sheets for each Illinois county on our website. When looking at the data by race and ethnicity, care needs to be taken in interpreting the data because of sample sizes and margins of error. For example, Richland County shows 98.1% of Black children in poverty. Yet, the estimated population of black children is 53 with a margin of error at +/- 65. However, when examining several counties with 250 or more Black children, you can still see the disparities in child poverty rates.

Source: 2021-2017 American Community Survey, U.S. Census Bureau
More populous counties:

Source: 2021-2017 American Community Survey, U.S. Census Bureau
Looking at either the composite state child poverty rate or a composite county child poverty rate can be misleading because it does not illustrate the existing disparities by race and ethnicity. This can misinform lawmakers such that the public policies adopted to address child poverty may not get at barriers specific to each demographic group. Yet, even these numbers do not tell the whole story. Many academics have looked at what income is really required to meet basic household needs. In 2022, the federal poverty level for a family of four was $27,750. The Economic Policy Institute has examined the income level a two-adult/two-child household needs to attain a modest yet adequate standard of living. The calculations take into account household expenses that include housing, food, transportation, health care, child care and taxes. By that gauge, the average for all Illinois counties is $81,591 or 2.94 times the official poverty level.
Economic Policy Institute : The income a family needs to attain a modest yet adequate standard of living.
[In 2020 dollars].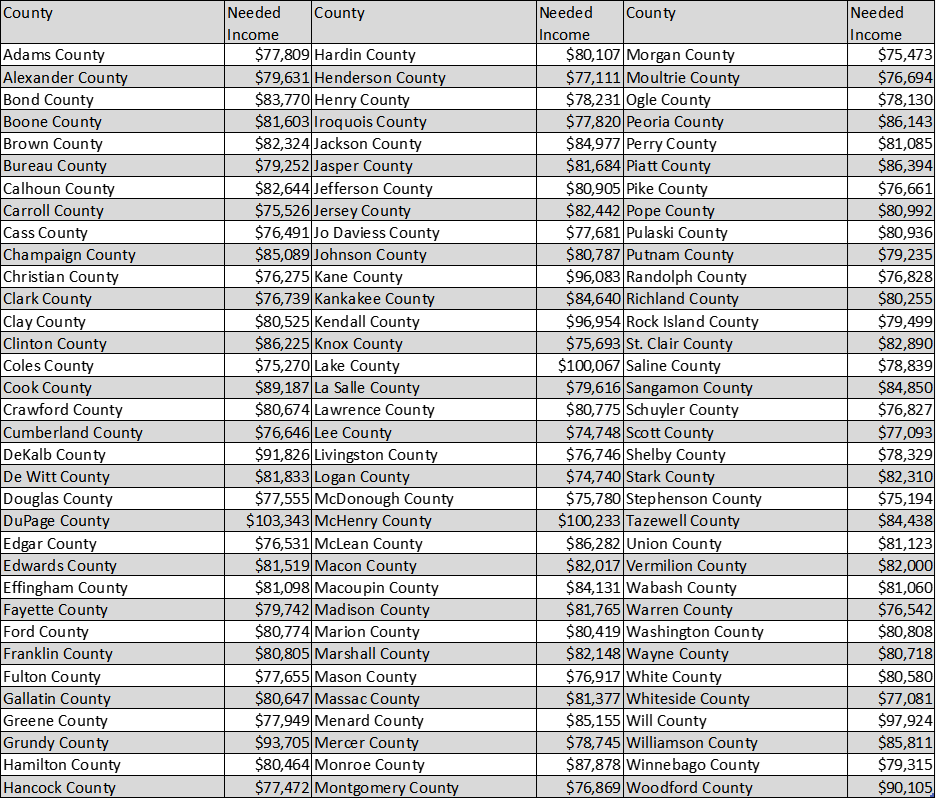 Census figures show more than one million Illinois children were below 250% FPL in 2021.

Source: 2021-2017 American Community Survey Data pulled from IPUMS USA.
Thus, nearly 2/3 of Black and Latinx children and more than 40% of all Illinois children are in households below an income considered necessary to meet basic household needs and maintain an adequate standard of living. Furthermore, where the percentages below 100% FPL were 9.1% for white, non-Latinx children and 35.5% for Black children (or a difference of 26.4%) at below 250% FPL the percentage is 30.3% for white, non-Latinx children and 69.0% for Black children (or a difference of 38.7%). Not only do disparities remain but they widen.
While the difference between white, non-Latinx children and Latinx children goes from 9.1% and 19.2% respectively at below 100% FPL to 30.3% and 62.8% at below 250% FPL respectively, that may not tell the entire story. The U.S. Census Bureau does not make regular adjustments to the American Community Survey to account for undercounts in census data. They do release reports on undercounts after the decennial census .
In 2022, the Census Bureau reported the Hispanic or Latino population had a statistically significant undercount rate of 4.99%[i]. Consequently, reported situations of poverty, income, and all other statistics might be off, and much worse than displayed.
The most recent Household Pulse Survey from the Census Bureau (April 26-May 8, 2023) shows many Illinois households still struggle to meet basic needs such as food security and housing even with existing state and federal programs. Census data shows the poorest Illinois residents are paying the most in rent. Housing is a necessity; it is not a luxury item. To be rent burdened means to be paying more than 30% of monthly income on rent. Currently, 44% of Illinois renters are rent burdened. Renters with the lowest income are also paying the most out of their pockets for rent. For Illinois households earning less than $20,000, 88.2% are rent burdened. For those households earning more $75,000 or more, just 5.3% are rent burdened. The numbers also differ by region, which is a factor of income as well as the stock of affordable housing. In Kendall County, 99.5% of those making under $20,000 are rent burdened.
High housing costs are a direct driver of poverty. Families facing high housing costs must restrict their expenditures on other basic necessities[ii]. Data from the National Equity Atlas shows that in 2020 35% of Black households renting were severely rent burdened (spending more than 50% of income on housing) versus 22% of white households[iii].

Source: U.S. Census Bureau
Public Assistance
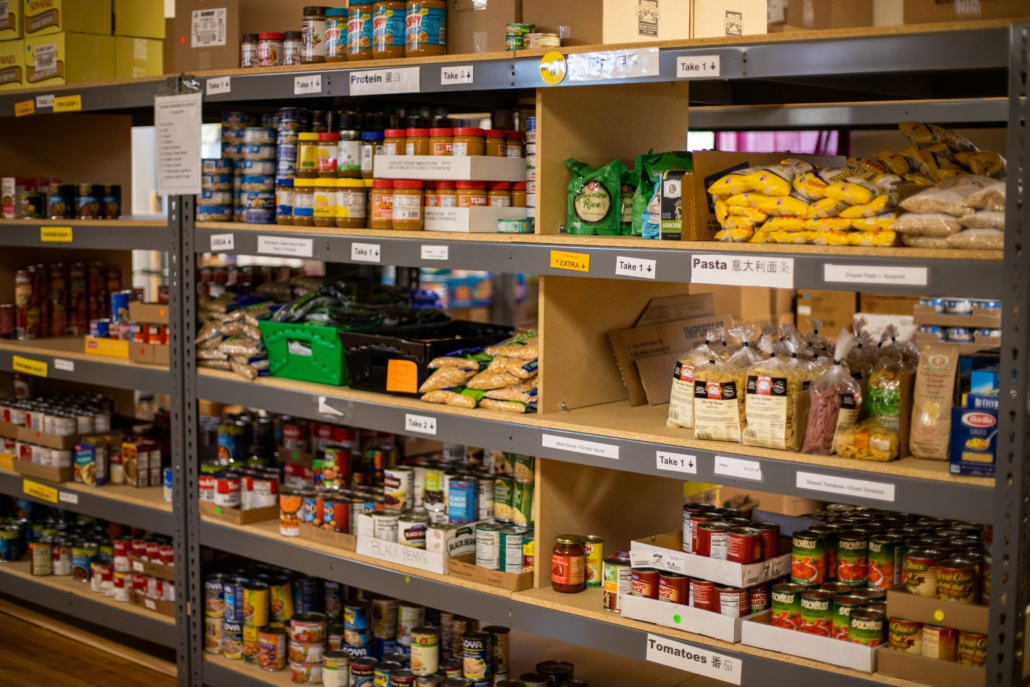
Cycles of poverty cannot be broken without adequate food and health care. Children cannot go to school, focus, and learn if they are hungry or sick.
SNAP provides households with extra funds to spend on food each month. Census data shows about 20% of Illinois households with children are recipients of SNAP. About 36% of Illinois children are on public health insurance .

Source: U.S. Census Bureau
Additional Economic Assistance
In 2021, during the height of the pandemic, the federal government expanded the federal child tax credit. The maximum credit amount increased from $2,000 to $3,600 per child under age 6 and to $3,000 per child ages 6-17. The federal government also made the credit fully refundable to low-income households. Combined with other federal relief efforts, the child tax credit expansion cut the nation’s child poverty rate almost in half. Columbia University estimates the federal child tax credit alone (without other federal benefits) cut child poverty by close to 30%[iv] and more than 90% of households used the credit for food, utilities, housing costs, clothing, or education[v]. However, that expansion lasted for just one year and as the data above shows, many households are still far short of the income level necessary to meet basic household needs and an adequate standard of living. With a divided Congress, the nation may not see a reinstatement of the enhanced federal child tax credit any time soon.
As of 2022, 11 states had some form of a child tax credit[vi]. Children’s Advocates for Change was part of a larger coalition that pushed this spring for an Illinois child tax credit. While the legislature did not include that provision in the Fiscal Year 2024 budget, CAFC will continue to push for the measure. CAFC also worked with Illinois legislators on an income tax credit for renters. Current Illinois law allows homeowners to take a portion of their property tax bill as a credit against any state income tax liability. While the measure received a legislative hearing, the General Assembly did not act on it. CAFC will continue its work on this effort as well to see that all Illinois children have the necessary resources to thrive.
Written by Helen R. Weigle Fellow Fran Delacey and Mitch Lifson
[i] https://www.census.gov/newsroom/press-releases/2022/2020-census-estimates-of-undercount-and-overcount.html
[ii] Kimberlin, Sara, Laura Tach, and Christopher Wimer. 2018. “A Renter’s Tax Credit to Curtail the Affordable Housing Crisis.” RSF: The Russell Sage Foundation Journal of the Social Sciences 4(2): 131–60.
[iii] https://nationalequityatlas.org/indicators/Housing_burden?geo=02000000000017000&houseburd01=2
[iv] Zachary, Parolin, Sophie Collyer, Megan Curran. 2022. « Sixth Child Tax Credit Payment Kept 3.7 Million Children Out of Poverty.” Columbia University Center on Poverty and Social Policy. Vol. 6, No. 1. f
[v] https://www.cbpp.org/blog/9-in-10-families-with-low-incomes-are-using-child-tax-credits-to-pay-for-necessities-education
[vi] Waxman, Samantha, and Iris Hinh, March 3, 2023, “States Can Enact or Expand Child Tax Credits and Earned Income Tax Credits to Build Equitable, Inclusive Communities and Economies”, Center on Budget and Policy Priorities.
