• Facebook
  • Twitter
  • LinkedIn
  • Home
  • Contact
  • Blog
Children's Advocates for Change
  • About Us
    • Our Game Plan
    • Board of Directors
    • Staff
    • Fellows
  • Policy & Legislation
  • News & Resources
    • Fact Sheets and Publications
    • Data and Maps
    • Newsletters
    • Media
    • Press Releases
    • Blog
  • Gallery
  • Donate
  • Search
  • Menu Menu
Company News

Economic Supports and Child Maltreatment

Across the country in Federal Fiscal Year 2021, there were 588,229 victims of child neglect and abuse based on reports from states, the District of Columbia, and the Commonwealth of Puerto Rico. That averages to a victimization rate of 8.1 per 1,000 children.[1] Of the close to 600,000 reports of child maltreatment three-quarters (76%) were cases of neglect compared to 16% that were physical abuse and 10% which were cases of sexual abuse.[2]

Young children continue to be a greatest risk of abuse or neglect. [3]

There are also sharp racial differences in the reported cases of maltreatment. Overall, the victimization rate is highest for American-Indian or Alaska Native children (15.2 per 1,000 children) followed by African-American children (13.1 per 1,000). The victimization rate for Hispanics was 7.7 per 1,000 and for whites 7.1 per 1,000. That said, the victimization rates listed in a 2023 report from the U.S. Department of Health and Human Services regarding Illinois children by race and ethnicity are[4]:

  • 27.4 per 1,000 for Black children,
  • 10.1 per 1,000 for Hispanic children and
  • 10.9 per 1,000 for white children

In many cases of neglect, poverty is a significant factor. In fact, a number of academic studies have documented that the social determinants of health that include poverty, parental educational attainment, housing instability, food insecurity, and uninsurance are associated with child maltreatment.[5] Furthermore, as adults, maltreated children are at increased risk for behavioral, physical and mental health problems that include depression, obesity, high-risk sexual behaviors, and alcohol and drug misuse. [6]
________________________________________________________________________________________________________________

Poverty versus Child Neglect:

Much of the data cited here is based on state reports of child abuse and neglect. Neglect is based on state and federal definitions.

The CDC use the following definition of child maltreatment as:
Any act or series of acts of commission (physical abuse, sexual abuse, psychological abuse) or omission (physical neglect, emotional neglect, medical/dental neglect, educational neglect, inadequate supervision, exposure to violent environments) by a parent or other caregiver that results in harm, potential for harm, or threat of harm to a child.

Child Maltreatment Surveillance, Uniform Definitions for Public Health and Recommended Data Elements, Centers for Disease Control and Prevention, January 2008

However, a pair of former federal officials also note:
“Poverty is a risk factor for neglect, but poverty does not equate to neglect. The presence of poverty alone does not mean a child is unsafe, unloved, or that a parent lacks the capacity to care for his or her child.”

Jerry Milner, Former Associate Commissioner of the Children’s Bureau, U.S. Department of Health and Human Services David Kelly, Special Assistant to the Associate Commissioner

Milner, J. & Kelly, D. (December 2019/January 2020). It’s time to stop confusing poverty with neglect.; Children’s Bureau Express, 2010).
___________________________________________________________________________________________________________________

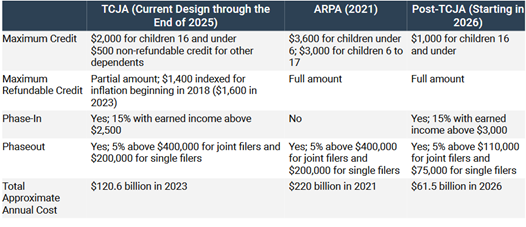
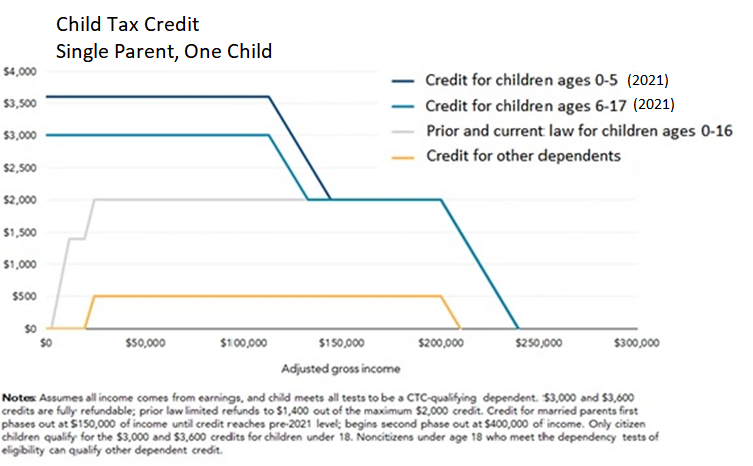
Given the impact of poverty, one cannot ignore the tremendous impact the 2021 enhanced federal child tax credit had in reducing poverty. The enhanced credit not only increased the maximum credit level from $2,000 per child to $3,600 for children under the age of six and $3,000 for children ages 6-17 but it also made the full value of the credit available to more low-income families. It had a dramatic impact on children and families. The U.S. Census Bureau estimates the 2021 expansion of the federal Child Tax Credit lifted 2.1 million children out of poverty.[7] The Census Bureau arrived at this estimate using the Supplemental Poverty Measure.[8]

Unfortunately, Congress authorized this significant anti-poverty measure for only one year (2021) during the height of the pandemic. Since then, with the credit falling back to $2,000, it has not been able to agree on an increase in the credit. The impact of the inaction is significant. Census figures show that, based on the SPM, child poverty increased nationally from 5.2% in 2021 to 12.4% in 2022.[9]

The Census Bureau has not yet released the latest state SPM figures. However, the state supplemental poverty measurement rate from the census bureau went from 12.7% in 2019 for children under age 18 to 5.5% in 2021 (a reduction of 56.7%).[10] It is expected that when the Bureau releases the state 2022 rates later this year, the number will show an increase similar to the national figure.

The Census Bureau numbers out on the official child poverty rates in 2022 show that the child poverty rate for Black Illinois children is four times that of white/non-Latinx Illinois children (9.0% vs 36.1%) and the child poverty rate for Latinx children (18.7%) is more than twice the rate for white/non-Latinx children.[11] Thus, with markedly higher poverty rates, the current rates of maltreatment by race, and poverty being a significant factor in child maltreatment, it would appear Black children are at a higher risk of child maltreatment.

The numbers show the impact additional economic supports such as the Child Tax Credit and the Earned Income Tax Credit can have on reducing poverty and a number of studies point to the correlation between reducing child maltreatment by reducing poverty.  The reasons may vary. As a report on economic supports and child well-being from Chapin Hall at the University of Chicago notes, financial supports may reduce parental stress. [12]

Here are just a few of the studies examining the impact of additional economic supports on child maltreatments:

  • With the enhanced federal child tax credit, the federal government also advanced half the credit to taxpayers in monthly payments. An examination of data from Georgia hospitals shows the advance payments were associated with fewer child abuse and neglect related emergency department visits.[13]
  • Modeling of the Earned Income Tax Credit shows a 10% increase in state EITC benefits was associated with 241 fewer reports of neglect per 100,000 children.[14]
  • A refundable EITC was associated with a decrease of 3.1 abusive head trauma admissions per 100,000 population in children aged <2.[15]
  • A refundable state EITC was associated with an 11% decrease in foster care entries compared to states without a state-level EITC after controlling for child poverty rates, racial/ethnic composition, education and unemployment. [16]
  • An examination of Temporary Assistance for Needy Families data from 2001 to 2010 found that increases in maximum allowable TANF cash benefits and greater access to TANF benefits decreased mothers’ self-reports of physical maltreatment.[17]

In its review of state policy options to increase access to economic supports as a child welfare prevention strategy, Chapin Hall lists a number of recommendations that include:

  • Establishing a refundable state level Child Tax Credit,
  • Establishing a refundable state-level Earned Income Tax Credit (not only increasing the level of the credit but also implementing measures to increase EITC uptake such as supplied fax filing),
  • Increasing the state minimum wage (currently $14 per hour and slated to go $15 next year),
  • Implementing paid family leave and
  • Better leveraging funding opportunities to support well-paying , stable employment – including redesigned TANF work programs.

Other measures cover child care, housing, medical care, the Supplemental Nutrition and Assistance Program and the Women Infants and Children (WIC) Program.

Illinois currently has a state EITC (worth, in Tax Year 2024, 20% of a taxpayer’s claimed federal EITC) but could take a major step forward with the establishment of a state Child Tax Credit. Fourteen other states now have some form of a state Child Tax Credit.[18] As the research cited here indicates, a child tax credit can not only provide greater economic security to working families but potentially reduce family stressors and in the process reduce the number of child maltreatment cases.

Written by Tim Franklin and Mitch Lifson.


[1] U.S. Department of Health & Human Services, Administration for Children and Families, Administration on Children, Youth and Families, Children’s Bureau. (2023). Child Maltreatment 2021. Available from https://www.acf.hhs.gov/cb/data-research/child-maltreatment.

[2] https://www.childrensdefense.org/the-state-of-americas-children/soac-2023-child-welfare/

[3] Annie E. Casey Foundation, Child Maltreatment Trends: A Persistent Picture of Young Survivors and Neglect, August 9, 2023, https://www.aecf.org/blog/child-maltreatment-trends

[4] U.S. Department of Health & Human Services, Child Maltreatment 2021, (2023).

[5] Hunter, Amy and Flores, Glenn, “Social determinants of health and child maltreatment: a systematic review, Pediatric Research, 89-269-274, 2021.

[6] World Health Organization, Child maltreatment, September 12, 2022; https://www.who.int/news-room/fact-sheets/detail/child-maltreatment

[7] https://www.census.gov/content/dam/Census/library/working-papers/2022/demo/sehsd-wp2022-24.pdf

[8] Unlike the U.S. Census Bureau’s Official Poverty Measure, the SPM takes into account expenditures for food, clothing shelter, and child care (among other areas) as well as income from tax credits and other sources such housing subsidies, the Supplemental Nutrition Assistance Program, and the nutrition program under the Women, Infants, and Children (WIC) Program.

[9] https://www.census.gov/library/publications/2023/demo/p60-280.html

[10] U.S. Census Bureau, Supplemental Poverty Estimate using American Community Survey Public Use Data

[11] U.S. Census Bureau, 1-Year American Community Survey Data, 2022.

[12] Weiner, D.A, Anderson, C. and Thomas, K. (2021). System transformation to support child and family well-being: The central role of economic and concrete supports. Chicago, IL: Chapin Hall at the University of Chicago

[13] Bullinger, Lindsey Rose, and Boy, Angela. (2023). Association of Expanded Child Tax Credit Payments With Child Abuse and Neglect Emergency Department Visits. JAMA Network Open. 2023;6(2):e2255639

[14] Kovski NL, Hill HD, Mooney SJ, Rivara FP, Morgan ER, Rowhani-Rahbar A. Association of State-Level Earned Income Tax Credits With Rates of Reported Child Maltreatment, 2004-2017. Child Maltreat. 2022 Aug;27(3):325-333.

[15] Klevens J, Schmidt B, Luo F, Xu L, Ports KA, Lee RD. Effect of the Earned Income Tax Credit on Hospital Admissions for Pediatric Abusive Head Trauma, 1995-2013. Public Health Rep. 2017 Jul/Aug;132(4):505-511.

[16] Rostad, W. L., Ports, K. A., Tang, S., & Klevens, J. (2020). Reducing the Number of Children Entering Foster Care: Effects of State Earned Income Tax Credits. Child Maltreatment, 25(4), 393-397.

[17] Spencer RA, Livingston MD, Komro KA, Sroczynski N, Rentmeester ST, Woods-Jaeger B. Association between Temporary Assistance for Needy Families (TANF) and child maltreatment among a cohort of fragile families. Child Abuse Negl. 2021 Oct;120:105186.

[18] In 2023, Arizona had a one-time tax rebate program in place. Qualifying taxpayers could receive a rebate of $250 per dependent under age 17 and $100 per dependent over age 17 as claimed on their 2021 returns.  The maximum available rebate for taxpayer was $750.

February 5, 2024
https://childrensadvocates.org/wp-content/uploads/2024/02/sad-child.jpg 805 1303 Mitch Lifson https://childrensadvocates.org/wp-content/uploads/2022/03/childrens-advocates-change-logo.png Mitch Lifson2024-02-05 14:51:402024-08-07 08:33:58Economic Supports and Child Maltreatment
Company News

Illinois’ Tax System Widening Inequality

A new report by the Institute on Taxation and Economic Policy (ITEP) shows Illinois has the eighth most regressive state and local tax system in the country. A regressive tax system is one where low- and middle-income families pay a larger share of their incomes in taxes than upper-income families. In Illinois, households with the lowest 20% of incomes (less than $26,700) pay 14.8% of their income in taxes while the top 1% (over $749,400) pay just 7.3% of their income in taxes. The ITEP study documents that Illinois has the second-highest tax rate for the lowest 20% of household incomes. The average effective local and state tax rate in the U.S. for the lowest 20% of household incomes is 11.3%.

A regressive system not only widens economic disparities but has implications with regard to the racial and ethnic wealth gaps. In 2022, white/non-Latinx Illinois households already had a median income that was more than 78% higher than Black Illinois households ($80,404 vs $45,019). The median income level for Latinx Illinois households was $72,139. Consequently, when you factor in the ITEP analysis of tax burdens by income, the state has in place a tax system that puts a greater burden, on average, on Black and Latinx households than white/non-Latinx households.

This also has implications for the well-being of our state’s children where the 2022 child poverty rate for Black Illinois children is four times that of white/non-Latinx Illinois children (9.0% vs 36.1%) and the child poverty rate for Latinx children (18.7%) is more than twice the rate for white/non-Latinx children.

The ITEP study shows that 41 states tax the top 1% (by income) at a lower rate than any other income group. States with tax systems that reduce inequality are California, Maine, Minnesota, New Jersey, New York, and Vermont.

The majority of states with the ten most regressive tax systems either have no broad-based income tax or a flat-rate personal income tax (such as in Illinois). The Illinois Constitution states:

A tax on or measured by income shall be at a non-graduated rate. At any one time, there may be no more than one such tax imposed by the State for State purposes on individuals and one such tax so imposed on corporations.

In 2020, Illinois voters turned down a proposed change to that section of the state constitution that would have allowed a progressive income tax.

Progressive income tax rates, seen in all the least regressive state and local tax systems, as well as refundable tax credits (where a taxpayer can receive a refund check for the value of any tax credit that exceeds the tax liability of the filer) can help offset the impact of sales, excise, and property taxes, which tend to be regressive. Due to their financial situation, low-income families spend more of their income and save less than higher-income families. As a result, more of their income is subject to sales taxes that are imposed at a flat rate.

The regressive nature of sales taxes is compounded when the taxes apply to essential items for low-income households. While lower than the general tax rate of 6.25%, Illinois taxes groceries at a 1% rate.

According to the Center on Budget and Policy Priorities, Illinois is one of only a dozen states that as of last fall taxed groceries.[1] The state suspended the tax from July 1, 2022, through June 30, 2023, to help families deal with higher grocery prices during a time of high inflation. At a February 4, 2022 press conference touting the proposed tax, Governor J.B. Pritzker stated: The grocery tax is really one of the most regressive taxes, and because we have balanced our budget, and we have a surplus in Illinois, this is a straightforward way for us to help residents who need it most.[2]

Illinois also taxes relatively few services versus tangible items.  A 2017 survey by the Federation of Tax Administrators listed Illinois as taxing 29 services, while Kentucky taxed 40, Wisconsin 82, and Iowa 89.[3]

2021 study by Dartmouth Professor Diego Comin and his colleagues showed that wealthier consumers spend more on services and less on agriculture and manufactured goods.[4] In addition, services contributed 77.6% of the nation’s Gross Domestic Project in 2021.[5] Consequently, it appears that taxing fewer services benefits higher-income households.

In reference to property taxes, Illinois had some of the highest property taxes in the country in 2021.[6] Part of that is the result of the reliance local school districts place on the tax for operating revenue. While Illinois began adding an additional $350 million per year in state funding to the evidence-based school aid formula in 2018, local revenues still made up more than half of the school districts’ total revenue.[7]

Assessment exemptions for general homestead, veterans, the disabled, and seniors help reduce the distribution of the tax burden on some households. The state also allows income tax filers whose income does not exceed $250,000 (individually and $500,000 for married filing jointly), to take a tax credit of 5% of the filer’s property tax bill. However, that same relief is not available to renters – who are disproportionately individuals of color. Frequently, even with the property tax credit, renters pay a portion of the property taxes in their rent payments. A review of housing payments by the National Low-Income Housing Coalition shows that 86.4% of extremely low-income renter households in Illinois (0-30% of the Average Median Income) spend more than 30% of their income on housing.[8]

Remedies:

While changing the state’s personal income tax rates would require a constitutional amendment, state legislators can enact two short-term measures to provide greater economic security to Illinois families.

ITEP reports that all 10 of the states with the most equitable tax systems offer refundable state Earned Income Tax Credits (EITC) and nine of the 10 have refundable Child Tax Credits (CTC). Illinois has a state EITC (valued in Tax Year 2024 at 20% of a taxpayer’s claimed federal EITC) but not a CTC. Children’s Advocates for Change strongly supports the adoption of this measure to help working families deal with the additional costs of raising children. The credit can help low- and moderate-income families with food insecurity, rising rent, dental care, transportation costs, and a host of other needed goods and services. It’s also good for the local economies as credit recipients purchase necessary items for their households.

Another means of assisting with rising rental costs is the adoption of an income tax credit for renters. Statistics from the National Low Income Housing Coalition show that in 2023 Illinois had only 34 affordable and available homes for rent for every 100 households at or below 30% of the Average Median Income level and only 65 affordable and available homes for rent for every 100 households between 31% and 50% of the Average Median Income level.[9] While the state has adopted new incentives in recent years for the construction of affordable housing, a housing credit follows the renter. Consequently, it can assist with paying for rental units closer to employment locations (which also helps reduce transportation costs). It also helps promote greater housing stability. Housing instability can have a significant impact on children as they move from one school district to another.

These steps can be taken in the short term and would provide greater economic security for working families. In the long term, it may be necessary to look at Illinois’ income tax rates as well as the structure of the state’s income tax system. A November 15, 2023 Economic and Fiscal Policy Report from the Governor’s Office of Management and Budget projects -based on current taxes and expenditure patterns – a Fiscal Year 2025 (7/1/24-6/30/25) $721 million General Fund deficit ($891 million after an additional contribution to the Budget Stabilization Fund). That deficit grows through Fiscal Year 2028.[10]

In examining the income tax structure, it is also important to recognize that Illinois does not tax 401(K), retirement, pension, and social security benefits that the federal government taxes. The Fiscal Year 2021 Tax Expenditure Report from the Illinois Comptroller, which documents the value of Illinois tax credits and exemptions, shows that Illinois lost almost $2.9 billion in tax revenue due to these exemptions. Unlike the property tax credit, income is not a determining factor in these exemptions.

In the short and the long term, it is important for Illinois residents and our elected officials to  look at changes to the overall state and local tax system to make it more progressive.  Doing so will make the system more equitable with regards to household income, race, and ethnicity. It will also help ensure that all children and their families thrive.

Written by Mitch Lifson


[1] https://www.cbpp.org/12-states-impose-sales-tax-on-groceries
[2] https://wmbdradio.com/2022/02/04/pritzker-speaks-on-proposed-grocery-sales-tax-suspension-calls-out-republicans/
[3] https://taxadmin.org/state-taxation-of-services-by-category-2017/; 2017 is the last available survey from the FTA. Changes may have occurred since then.
[4] https://home.dartmouth.edu/news/2021/03/new-study-finds-income-not-prices-drives-economy
[5] https://www.statista.com/statistics/270001/distribution-of-gross-domestic-product-gdp-across-economic-sectors-in-the-us/
[6] https://taxfoundation.org/data/all/state/property-taxes-by-state-county-2023/
[7] https://www.nea.org/sites/default/files/2022-06/2022%20Rankings%20and%20Estimates%20Report.pdf
[8] https://nlihc.org/sites/default/files/SHP_IL.pdf
[9] https://nlihc.org/sites/default/files/SHP_IL.pdf
[10] https://budget.illinois.gov/content/dam/soi/en/web/budget/documents/economic-and-fiscal-policy-reports/Economic%20and%20Fiscal%20Policy%20Report%20FY24%20FINAL%2011.15.23.pdf

January 10, 2024
https://childrensadvocates.org/wp-content/uploads/2024/01/payment-scaled.jpg 1708 2560 Mitch Lifson https://childrensadvocates.org/wp-content/uploads/2022/03/childrens-advocates-change-logo.png Mitch Lifson2024-01-10 16:07:012024-08-07 08:33:58Illinois’ Tax System Widening Inequality
Company News

State Child Tax Credit Activity

State child tax credits, like the federal child tax credit, can have a positive impact on a child’s health, education, and even future earnings. (See prior blog post.)

Illinois House and Senate members introduced legislation this year in the Illinois General Assembly to establish state child tax credits (SB 1444 and HB 3950). The bills, identical, would have created a maximum credit of $700 per child in households with reported income of $75,000 for joint tax filers or $50,000 for other tax filers. Beyond those thresholds, the value of the credit reduces by $24 for each additional $1,000 in income. However,  neither bill made it out of its respective chamber.

Yet, several other states were successful in their efforts to create or expand state child tax credits. To date, 14 states have adopted state child tax credits (some are effective in future years). All but three  of the state credits are refundable, meaning a taxpayer may receive a refund from the state if the value of the credit exceeds the amount the taxpayer owes to the state.


Below is a review of the activity seen around the country:

New Credits

Minnesota

The state established a refundable child tax credit with a maximum value of $1,750 for each qualifying child under the age of 18. Effective next year (for payment of 2023 taxes), the maximum credit is available for children in households where joint tax filers make less than $35,000 or less than $29,500 for all other filers.

Oregon

The state established a refundable credit with a maximum value of $1,000 for each qualifying child up to the age of six. Effective next year (for payment of 2023 taxes), the maximum credit is available to households with reported incomes of under $25,000.

Utah

The state established a non-refundable tax credit of $1,000 for each qualifying child aged 1-3. Effective next year (for payment of 2023 taxes), the maximum credit thresholds (after which the credit begins to phase out) are $54,000 for joint tax filers, $43,000 for single or head of household filers, and $27,000 for single filers.

Enhanced Credits

New Mexico

Effective next year (for payment of 2023 taxes), approved legislation increases the state’s child tax credit for the lowest three income levels from $175 to $600, $150 to $400, and $125 to $200. The maximum value credit applies to households reporting income of less than $25,000.

New York

Prior to action this year, the state’s child tax credit was available to children aged 4-17. With this year’s action by the state, the credit will now include children under the age of 4. Eligibility thresholds are $110,000 for joint tax filers, $75,000 for single filers, and $55,000 if married filing separately. The value of the credit is the greater of 33% of the portion of the taxpayer’s federal child tax credit or additional child tax credit attributable to qualifying children or $100 multiplied by the number of qualifying children.

New Jersey

The state doubled the value of its refundable child tax credit to $1,000. The credit applies to children five or younger. The maximum credit value is available to households with reported income of $30,000 or less.

Maryland

Previously the state’s $500 child tax credit was available to taxpayers making $6,000 or less with children under 17 with a disability. The state has now expanded availability to individuals making $15,000 or less and for children under the age of six.

One-Time Rebate

Arizona Governor Katie Hobbs signed a new one-time Child Tax Rebate that provides eligible families $250 per child up to three dependents.


Sources for post: Center on Budget and Policy Priorities, Institute on Taxation and Economic Policy, Tax Credits for Working Families, The Rockefeller Foundation and various news media reports.
https://www.cbpp.org/blog/momentum-for-new-and-expanded-state-child-tax-credits-earned-income-tax-credits-continued-in
https://itep.org/refundable-credits-winning-policy-choice-2023-child-tax-credit-eitc/
https://www.taxcreditsforworkersandfamilies.org/state/utah/
https://www.rockefellerfoundation.org/blog/a-wave-of-child-tax-credits-is-building-in-the-states/
https://newjerseymonitor.com/briefs/budget-panels-approve-child-tax-credit-expansion/
https://tax.thomsonreuters.com/news/new-mexico-governor-approves-rebates-and-certain-tax-cuts/
https://www.niskanencenter.org/new-mexico-child-tax-credit-expansion-needs-simplification/
https://www.silive.com/news/2023/04/2023-stimulus-update-ny-child-tax-credit-will-be-expanded.html
https://www.kiplinger.com/taxes/minnesota-rebate-checks-and-child-tax-credit


September 13, 2023
https://childrensadvocates.org/wp-content/uploads/2024/07/CTC-U.S.jpg 725 934 Mitch Lifson https://childrensadvocates.org/wp-content/uploads/2022/03/childrens-advocates-change-logo.png Mitch Lifson2023-09-13 12:57:412024-08-07 08:33:58State Child Tax Credit Activity
Company News

The Case for a State Child Tax Credit

History of the Federal Child Tax Credit

While first established in 1997, the federal child tax credit in 2016 had a maximum value of $1,000 for children 16 and under. An individual had to earn more than $3,000 and the credit value phased into the maximum value. The credit was fully refundable, meaning if the value of the credit exceeded a taxpayer’s tax liability then the taxpayer could receive a refund for the difference.

The Tax Cuts and Jobs Act (TCJA) of 2017, increased the Child Tax Credit in 2018 to $2,000. The phase-in started at $2,500 and the credit refund was capped at $1,400 (an amount indexed to inflation that is worth $1,600 in 2023). Those changes now are in effect through 2025, when the tax parameters revert to the pre- TCJA guidelines.

In 2021, during the height of the pandemic, the federal government expanded the federal Child Tax Credit for but only one year. The maximum credit amount increased from $2,000 to $3,600 per child under age 6 and to $3,000 per child between the ages of 6 and 17. The federal government also made the credit fully refundable to low-income households. There was no income threshold to begin receiving the credit.

Source: Tax Foundation

Source: Urban-Brookings Tax Policy Center

 Impact of the Child Tax Credit on Poverty

The 2021 enhanced federal Child Tax Credit, along with other economic supports, had a tremendous impact in lifting children out of poverty. Nationally, the supplemental child poverty rate dropped from 12.6% in 2019 to 5.2% in 2021. (Unlike the official poverty rate calculated by the Census Bureau, the supplemental poverty rate takes into account certain government benefits -such as Supplemental Nutrition Assistance Program benefits, WIC [Women, Infants and Children] benefits, the Earned Income Tax Credit [EITC], the Child Tax Credit [CTC], and housing subsidies – as well as household expenses that include childcare costs, taxes, work expenses, and medical expenses[i].)

In Illinois, the supplemental poverty measurement rate from the census bureau went from 12.7% in 2019 for children under age 18 to 5.5% in 2021 (a reduction of 56.7%)[ii]. In 2022, because of the changes in the Child Tax Credit provisions (reinstating minimum income, capping the refund amount), an estimated 664,000 Illinois children under the age of 17 became ineligible for the full credit. The number includes 217,000 Latinx children, 199,000 white children and 198,000 Black children[iii].

Number (in thousands) and Percentage of Children in SPM Poverty
Under age 18
Number Percent
Estimate M.O.E. (+/-)1 Estimate M.O.E. (+/-)1
2021 Illinois 152 15 5.5 0.5
2019 Illinois 357 18 12.7 0.7
2017 Illinois 427 18 14.8 0.6
Data are based on a sample and are subject to sampling variability.  
Source: U.S. Census Bureau, 2009 through 2019 and 2021 American Community Survey Public Use 1-year estimates.

Exactly how many children who were lifted out of poverty in 2021 but now live in poverty is unclear. The Census Bureau will release 2022 statistics later this fall. The 2019 supplemental poverty measurement of children in poverty (an estimated 357,000) gives some indication. However, impacting that number are variations in job and wage growth both at the height of the pandemic and at the end of last year.

Without accounting for the additional revenue and expenditure measurements in the supplemental poverty measurement, the Bureau’s official poverty measurement shows the following for those in poverty and those in deep poverty (or 50% of the Federal Poverty Level):

        Children under the age of 18
2021 2019 2017
Illinois children in poverty Below 50% FPL        213,584        175,016        215,972
Illinois children in deep poverty Below 100% FPL        442,261        436,327        486,196
Percentage of Illinois children in poverty 16.0% 15.7% 17.0%
Numbers reflect those for whom the poverty status is determined.  
Source: U.S. Census Bureau, American Community Survey 1-year data      

Household Needs and State Activity

It’s very likely that with a minimum income level reinstated, those in deep poverty will be most impacted by the federal Child Tax Credit changes. While inflation has decreased from the recent peak of 9.1% in June (year-to-year), food prices and rents still remain high. Data from the Census Bureau’s Household Pulse Survey (covering July 26-August 7, 2023) shows of all Illinois households with children answering the survey 12.9% either often or sometimes did not have enough to eat in the last seven days. That value rose to 38.2% for Black households with children and 19.6% for Latinx households with children. Even in households receiving assistance under the Supplemental Nutrition Assistance Program the number stood at 25.4%[iv].

The Greater Chicago Food Depository reports (based on data collected by Northwestern University) that 23% of Chicago metro area households with children were food insecure from March-April 2023[v].  The Depository also reports that of its network of more than 800 partner pantries and meal program sites across Cook County served 31% more guests in May of 2023 than the same month last year.

A previous blog post noted not only the racial disparities in poverty (and the fact that poverty for Latinx and Black children grew from 2019 to 2021) but also the fact that most two-adult/two-child households need closer to 3 times the official poverty level to meet household expenses and attain a modest standard of living.

The noted reduction in child poverty with the enhanced federal Child Tax Credit combined with the failure of Congress to continue that enhancement beyond one year calls for the need for a state Child Tax C\credit to help reduce child poverty. Utah, Oregon, and Minnesota adopted state Child Tax Credits this year and join 11 other states. In all except four states the credit will be refundable for 2023 tax year.  (In addition, Arizona adopted a one-time child tax rebate.) Minnesota Governor Tim Walz predicts the state’s new Child Tax Credit will cut child poverty in Minnesota by one-third[vi].

It is more than just the short-term economic infusion of cash.

Child Welfare Prevention

Research shows social determinates of health (including poverty, housing instability, and food insecurity are associated with child maltreatment[vii]. Additional research documents that with increasing county child poverty rates, total and type-specific official maltreatment rates increased in all race/ethnicity groups[viii].

Increased economic supports are associated with a decreased risk for neglect and physical abuse[ix]. A study published of cross-sectional study of 3,169 emergency department visits related to child abuse or neglect found fewer child abuse and neglect-related visits in the four days following expanded Child Tax Credit payments in 2021[x]. Another study found the Earned Income Tax Credit (EITC) and federal Child Tax Credit (CTC) are associated with a 5% reduction in child maltreatment reports in the four weeks following families’ receipt of the tax credit.

Children’s Health

Poverty, and associated factors such as inadequate nutrition, can negatively impact the development of a child’s body, including the brain. Children who directly or indirectly experience risk factors associated with poverty have higher odds of experiencing poor health problems as adults such as heart disease, hypertension, stroke, obesity, certain cancers, and even a shorter life expectancy[xi].

Research on the EITC (refundable on both the state and federal levels) shows increases in the credit have led to improvements in birth weight and lowered premature births[xii].  Contributing factors may be improved access to prenatal care and reduced maternal stress[xiii].

Education

According to the Urban Institute, persistently poor children (children poor at least half of the years from birth through age 17) are 13% less likely to complete high school by age 20 and 43% less likely to complete college by age 25 than other poor children[xiv]. Contributing to lower academic achievement is residential instability due to poverty.

Research suggests that an additional $1,000 in in the EITC for a household with children when a child is 13 to 18 years old increases the likelihood of completing high school by 1.3% and completing college by 4.2%[xv].

Economic Benefits

The economic benefits from the ETIC or CTC accrue not just to recipients of the credits but state and local economies as well. For low-wealth households, the marginal propensity to consume (that is how much more a person spends when their income increases) is 10 times larger than it is for wealthy households[xvi]. A state will recoup part of the spending through sales taxes and the economic activity may generate more jobs. One Congressional report estimates that the expanded federal CTC created significant benefits for local economies with $1.25 generated for each $1 in CTC payments[xvii].  A working paper issued by National Bureau of Economic Research estimates that for households earning less than $50,000 for each $100 increase in CTC payments those households spend $85 with the top categories housing ($33.18), food ($29.50), clothing ($7.87) and transportation ($7.67)[xviii].

Unlike programs where a benefit may only be used by a recipient for food, housing, or another specific purpose, a state child tax credit provides a family the flexibility to use the new financial resources in a way that best suits the household -whether it is for food, housing, child care, transportation, or clothing.

Time to Act

There are short and long-term benefits to the state by creating a state Child Tax Credit. There are the short-term benefits of addressing food insufficiency and housing instability as well as the noted economic activity around the state. With the potential of improved health, educational attainment, and even future earnings as children move to adulthood, the credit offers potential long-term savings for the state. In addition, given the Illinois’ flat income tax provision and the regressive nature of our state and local tax systems, a state child tax credit adds greater progressivity into the system.

The 2021 federal action to expand the Child Tax Credit showed how successful government can be in taking major steps to address child poverty when it decides to do so. Unfortunately, that effort lasted for only one year. Now the state needs to step in to build on that investment and give all children the opportunity to thrive.


Written by Mitch Lifson


[i] U.S. Census Bureau, Measuring America: How the U.S. Census Bureau Measures Poverty, June 2022

[ii] U.S. Census Bureau, Supplemental Poverty Estimate using American Community Survey Public Use Data.

[iii] Cox, Kris, Chuck Marr, Sarah Calame, and Stephanie Hingtgen, “Top Tax Priority: Expanding the Child Tax Credit in Upcoming Economic Legislation”, Center on Budget and Policy Priorities, June 12, 2023.

[iv] U.S. Census Bureau Household Pulse Survey, Week 60

[v] Greater Chicago Food Depository , “Food for Thought”, Summer 2023

[vi] A maximum credit of $1,750 per child for households of $29,500 for single tax filers and $35,000 for joint tax filers. The credits begin to decrease after reaching those thresholds.

[vii] Hunter, Amy and Glen Flores, “Social determinants of health and child maltreatment: A systematic review”,

Pediatric Research, 89, 269–274, 2021.

[viii] Kim, Hyunil, and Brett Drake, “Child maltreatment risk as a function of poverty and race/ethnicity in the USA”, Oxford University Press 2018.

International Journal of Epidemiology, 47, 780–787.

[ix] Monahan, Emma Kahle, Yasmin Grewal-Kok, Gretchen Cusic, and Claire Anderson, “Economic and concrete supports: An evidence-based service for child welfare prevention”, Chapin Hall, April 2023

[x] Bulinger, Lindsey Rose, and Angela Boy, “association of Expanded Child Tax Credit Payments with Child Abuse and Neglect Emergency Department Visits, JAMA Network, February 16, 2023.

[xi] https://www.all4kids.org/news/blog/poverty-and-its-effects-on-children/

[xii] Marr, Chuck, Chye-Ching Huang, Arloc Sherman, and Brandon Debot, “EITC and Child Tax Credit Promote Work, Reduce Poverty, and Support Children’s Development, Research Finds”, Center on Budget and Policy Priorities, October 1, 2015.

[xiii] Evans, Willian and Craig Garthwaite, “Giving Mom a Break”, American Economic Journal: Economic Policy, vol. 6, no. 2, May 2014 ; Anna, Aizer, Laura Stroud, and Stephen Buka, “Maternal Stress and Child Well-Being: Evidence from Siblings,” 2009, http://www4.gsb.columbia.edu/filemgr?file_id=6296; and

Adriana Camacho, “Stress and Birth Weight: Evidence from Terrorist Attacks,” American Economic Review, vol. 98,

  1. 2, pp. 511–515, May 2008.

[xiv] Ratcliffe, Caroline, “Child Poverty and Adult Success”, Urban Institute, September 2015

[xv] Bastian, Jacob, and Katherine Michelmore, “The Long-Term Impact of the Earned Income Tax Credit on Children’s Education and Employment Outcomes”, SSRN, 2017

[xvi] Fisher, Jonathan, David Johnson, Timothy Smeeding, and Jeffrey P. Thompson, “Estimating the Marginal Propensity to Consume Using the Distributions of Income, Consumption, and Wealth.” Federal Reserve Bank of Boston Research Department Working Papers No. 19-4, 2019. https://doi.org/10.29412/res.wp.2019.04

[xvii] Joint Economic Committee Democrats, “The Expanded Child Tax Credit Dramatically Reduced Child Poverty in 2021”, November 30, 2022.

[xviii] Schild, Jake; Sophie M. Collyer, Thesia Garner, Neeraj Kaushal, Jiwan Lee, Jane Waldfogel, and Christopher T. Wimer, “Effects of the Expanded Child Tax Credit on Household Spending: Estimates based on U.S. Consumer Expenditure Survey Data”, National Bureau of Economic Research, Working Paper 31412, June 2023

August 30, 2023
https://childrensadvocates.org/wp-content/uploads/2023/09/Child-Tax-Credit.png 544 816 Mitch Lifson https://childrensadvocates.org/wp-content/uploads/2022/03/childrens-advocates-change-logo.png Mitch Lifson2023-08-30 09:13:192024-08-07 08:33:58The Case for a State Child Tax Credit
Company News

Needing Just the Basics

Many Illinois households with children are just trying to pay the rent and put three full meals on the table. Even with government assistance, it remains a struggle for them. In 2021, nearly 1 in 6 Illinois (15.8%) children (or more than 440,000) were in poverty. Although this is an improvement from 2017 (18.8%), the data shows stark racial and ethnic disparities remain regarding child poverty. The child poverty rate decreased at a faster rate for Black and Latinx children from 2017 to 2021 (4.9% and 5.9% respectively), however it has been increasing recently for Black and Latinx families with the poverty rate for Black children at 35.5%, Latinx children at 19.2%, and white, non-Hispanic children at 9.1%.

Source: U.S. Census Bureau, American Community Survey

Source: U.S. Census Bureau, American Community Survey

Child poverty impacts every region in the state, but the picture differs depending on whether you look at the percentage of children in poverty versus the actual number of children in poverty. While Cook, Lake, and Winnebago counties (all in northern Illinois) have the highest numbers of children below the poverty level, Alexander, Pope, and Perry counties (all in southern Illinois) have the highest percentages of poverty for children.

Five Illinois counties that have the greatest percentage of children below 100% of the Federal Poverty Level.
Alexander County 35.8%
Pope County 35.0%
Perry County 31.2%
Vermilion County 29.1%
Jackson County 25.5%

Source 2021, 5-year American Community Survey

Five Illinois counties that have the greatest number of children below 100% of the Federal Poverty Level.
Cook County 210,002
Lake County 17,608
Winnebago County 16,652
Kane County 16,182
Will County 15,608

Source 2021, 5-year American Community Survey

Children’s Advocates for Change has examined the data by counties, race, and ethnicity. You can find fact sheets for each Illinois county on our website. When looking at the data by race and ethnicity, care needs to be taken in interpreting the data because of sample sizes and margins of error. For example, Richland County shows 98.1% of Black children in poverty. Yet, the estimated population of black children is 53 with a margin of error at +/- 65. However, when examining  several counties with 250 or more Black children, you can still see the disparities in child poverty rates.

Source: 2021-2017 American Community Survey, U.S. Census Bureau

More populous counties:

Source: 2021-2017 American Community Survey, U.S. Census Bureau

Looking at either the composite state child poverty rate or a composite county child poverty rate can be misleading because it does not illustrate the existing disparities by race and ethnicity. This can misinform lawmakers such that the public policies adopted to address child poverty may not get at barriers specific to each demographic group. Yet, even these numbers do not tell the whole story. Many academics have looked at what income is really required to meet basic household needs. In 2022, the federal poverty level for a family of four was $27,750. The Economic Policy Institute has examined the income level a two-adult/two-child household needs to attain a modest yet adequate standard of living. The calculations take into account household expenses that include housing, food, transportation, health care, child care and taxes. By that gauge, the average for all Illinois counties is $81,591 or 2.94 times the official poverty level.

Economic Policy Institute : The income a family needs to attain a modest yet adequate standard of living.
[In 2020 dollars].
Census figures show more than one million Illinois children were below 250% FPL in 2021.

Source: 2021-2017 American Community Survey Data pulled from IPUMS USA.

Thus, nearly 2/3 of Black and Latinx children and more than 40% of all Illinois children are in households below an income considered necessary to meet basic household needs and maintain an adequate standard of living. Furthermore, where the percentages below 100% FPL were 9.1% for white, non-Latinx children and 35.5% for Black children (or a difference of 26.4%) at below 250% FPL the percentage is 30.3% for white, non-Latinx children and 69.0% for Black children (or a difference of 38.7%). Not only do disparities remain but they widen.

While the difference between white, non-Latinx children and Latinx children goes from 9.1% and 19.2% respectively at below 100% FPL to 30.3% and 62.8% at below 250% FPL respectively, that may not tell the entire story. The U.S. Census Bureau does not make regular adjustments to the American Community Survey to account for undercounts in census data. They do release reports on undercounts after the decennial census .

In 2022, the Census Bureau reported the Hispanic or Latino population had a statistically significant undercount rate of 4.99%[i]. Consequently, reported situations of poverty, income, and all other statistics might be off, and much worse than displayed.

The most recent Household Pulse Survey from the Census Bureau (April 26-May 8, 2023) shows many Illinois households still struggle to meet basic needs such as food security and housing even with existing state and federal programs.Census data shows the poorest Illinois residents are paying the most in rent. Housing is a necessity; it is not a luxury item. To be rent burdened means to be paying more than 30% of monthly income on rent. Currently, 44% of Illinois renters are rent burdened. Renters with the lowest income are also paying the most out of their pockets for rent. For Illinois households earning less than $20,000, 88.2% are rent burdened. For those households earning more $75,000 or more, just 5.3% are rent burdened. The numbers also differ by region, which is a factor of income as well as the stock of affordable housing. In Kendall County,  99.5% of those making under $20,000 are rent burdened.

High housing costs are a direct driver of poverty. Families facing high housing costs must restrict their expenditures on other basic necessities[ii]. Data from the National Equity Atlas shows that in 2020 35% of Black households renting were severely rent burdened (spending more than 50% of income on housing) versus 22% of white households[iii].

Source: U.S. Census Bureau

Public Assistance
Cycles of poverty cannot be broken without adequate food and health care. Children cannot go to school, focus, and learn if they are hungry or sick.

SNAP provides households with extra funds to spend on food each month. Census data shows about 20% of Illinois households with children are recipients of SNAP. About 36% of Illinois children are on public health insurance .

Source: U.S. Census Bureau

Additional Economic Assistance
In 2021, during the height of the pandemic, the federal government expanded the federal child tax credit. The maximum credit amount increased from $2,000 to $3,600 per child under age 6 and to $3,000 per child ages 6-17. The federal government also made the credit fully refundable to low-income households. Combined with other federal relief efforts, the child tax credit expansion cut the nation’s child poverty rate almost in half.  Columbia University estimates the federal child tax credit alone (without other federal benefits) cut child poverty by close to 30%[iv] and more than 90% of households used the credit for food, utilities, housing costs, clothing, or education[v]. However, that expansion lasted for just one year and as the data above shows, many households are still far short of the income level necessary to meet basic household needs and an adequate standard of living. With a divided Congress, the nation may not see a reinstatement of the enhanced federal child tax credit any time soon.

As of 2022, 11 states had some form of a child tax credit[vi].  Children’s Advocates for Change was part of a larger coalition that pushed this spring for an Illinois child tax credit. While the legislature did not include that provision in the Fiscal Year 2024 budget, CAFC will continue to push for the measure. CAFC also worked with Illinois legislators on an income tax credit for renters. Current Illinois law allows homeowners to take a portion of their property tax bill as a credit against any state income tax liability. While the measure received a legislative hearing, the General Assembly did not act on it. CAFC will continue its work on this effort as well to see that all Illinois children have the necessary resources to thrive.

Written by Helen R. Weigle Fellow Fran Delacey and Mitch Lifson


[i] https://www.census.gov/newsroom/press-releases/2022/2020-census-estimates-of-undercount-and-overcount.html
[ii] Kimberlin, Sara, Laura Tach, and Christopher Wimer. 2018. “A Renter’s Tax Credit to Curtail the Affordable Housing Crisis.” RSF: The Russell Sage Foundation Journal of the Social Sciences 4(2): 131–60.
[iii] https://nationalequityatlas.org/indicators/Housing_burden?geo=02000000000017000&houseburd01=2
[iv] Zachary, Parolin, Sophie Collyer, Megan Curran. 2022. « Sixth Child Tax Credit Payment Kept 3.7 Million Children Out of Poverty.” Columbia University Center on Poverty and Social Policy. Vol. 6, No. 1. f
[v] https://www.cbpp.org/blog/9-in-10-families-with-low-incomes-are-using-child-tax-credits-to-pay-for-necessities-education
[vi] Waxman, Samantha, and Iris Hinh,  March 3, 2023, “States Can Enact or Expand Child Tax Credits and Earned Income Tax Credits to Build Equitable, Inclusive Communities and Economies”, Center on Budget and Policy Priorities.

June 14, 2023
https://childrensadvocates.org/wp-content/uploads/2023/06/aaron-doucett-liOAS02GnfY-unsplash-scaled.jpg 1707 2560 Mitch Lifson https://childrensadvocates.org/wp-content/uploads/2022/03/childrens-advocates-change-logo.png Mitch Lifson2023-06-14 11:27:492024-08-07 08:33:58Needing Just the Basics
Page 3 of 512345

Latest News

  • Illinois’ Fiscal Future: Projected DeficitsOctober 21, 2025 - 2:50 pm
  • Message from the CAFC’s President: Meeting the Challenge of a Federal Government ShutdownOctober 1, 2025 - 5:26 pm

Follow us on Facebook

Connect on Twitter

Tweets by childrensadvocs

Help Us Advocate for our Children

Make A Donation

OFFICE LOCATION

Children’s Advocates for Change
c/o Impact House
200 W. Madison Street, Suite 300
Chicago, IL 60606

Email: info@childrensadvocates.org
Main: 312-361-0101

STAY CONNECTED

  • facebook
  • twitter
  • instagram
  • youtube
  • linkedin

SUBSCRIBE TO US

Get news and events sent directly to your inbox. Send us an email at info@childrensadvocates.org to be added to our mailing list.

ASSOCIATIONS

Children’s Advocates for Change is a proud member the following networks:

Economic Analysis and Research Network

economic-analysis-research-network


Partnership for America’s Children

Notice of Non-Affiliation:
Children’s Advocates for Change is not affiliated, associated, authorized, endorsed by, or in any way connected with Voices for Illinois Children (“Voices”). Voices is an independent advocacy organization that is powered by YWCA Metropolitan Chicago.

© 2023 Children's Advocates for Change is a 501(c)(3) organization | Tax ID number: 88-2843645 Privacy Policy | Designed by JS Interactive, LLC
Scroll to top
Sign Up For News & Updates